


Reading the numbers
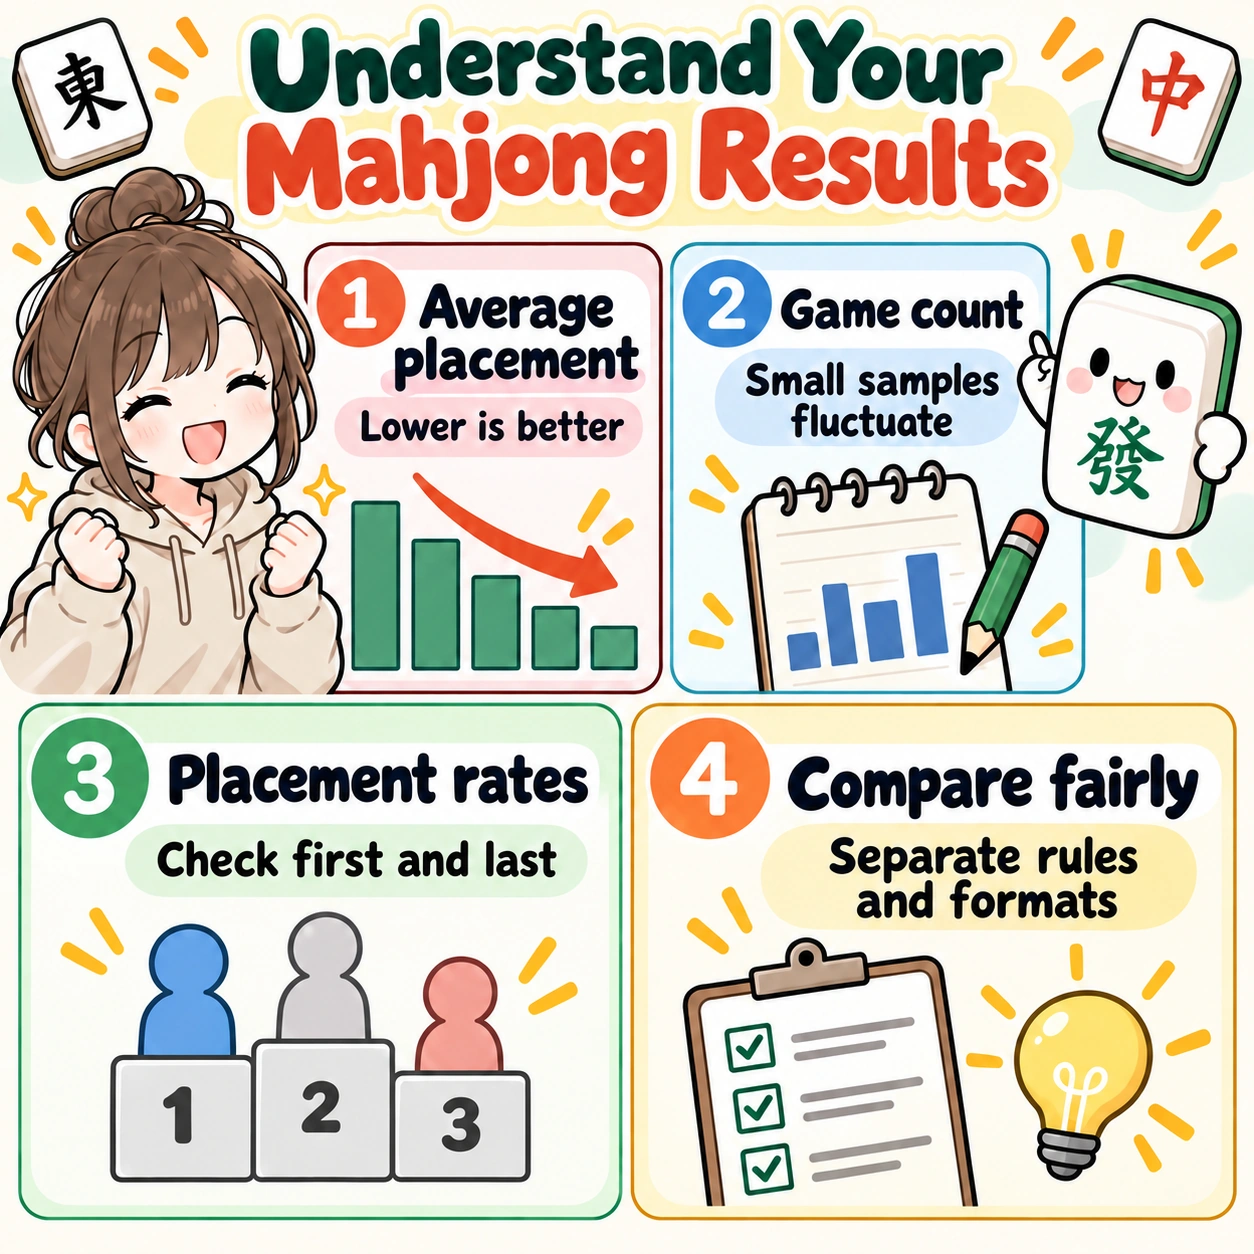
Average placement:
look at the breakdown too.
A lower number means you finished near the top more often. Use 2.50 for four-player mahjong and 2.00 for sanma as your baselines.
Three things to remember
- First- and last-place ratesWhich places you finish in
- Number of gamesA short winning streak or a long-term trend?
- Opponents and rulesAre you comparing the same conditions?
 Enlarge the illustration ↗
1. Average Placement Benchmarks for Four-Player Mahjong and Sanma
| Assessment / level | Four-player benchmark | Sanma benchmark | What it suggests |
|---|---|---|---|
| Top class | 2.29 or lower | 1.79 or lower | Outstanding results |
| Advanced to expert | 2.30〜2.39 | 1.80〜1.89 | Very strong results |
| Intermediate / strong results | 2.40〜2.44 | 1.90〜1.94 | Well above average |
| Above average | 2.45〜2.49 | 1.95〜1.99 | Better than the baseline |
| Average baseline | 2.50 | 2.00 | A starting point for assessing performance |
| Below average / struggling | 2.51 or higher | 2.01 or higher | Room for improvement |
Average placement is a useful guide when reviewing your performance. These benchmarks assume values displayed to two decimal places. Trends become easier to identify as your game count grows.
2. How to Calculate Average Placement
What is average placement in mahjong?
Average placement is the mean of your final finishes
Add your finishing places—1st, 2nd, 3rd, and 4th—as numbers, then divide by the number of games. Lower numbers mean better results. Unlike first-place rate alone, this measure includes second-, third-, and fourth-place finishes to summarize your overall performance.
Average placement formula
Average placement = (1st-place finishes × 1 + 2nd-place finishes × 2 + 3rd-place finishes × 3 + 4th-place finishes × 4) ÷ number of games
| Placement | Count |
|---|---|
| 1st | 30 times |
| 2nd | 27 times |
| 3rd | 23 times |
| 4th | 20 times |
| Average placement | (30+54+69+80)÷100=2.33 |
There is no fourth place in sanma. For example, with 38 firsts, 33 seconds, and 29 thirds, your average placement is (38 + 66 + 87) ÷ 100 = 1.91.
What can average placement tell you?
First-place rate alone makes it hard to distinguish someone who finishes both first and last often from a consistent player with many seconds. Last-place rate alone does not show how often you reach the top. Average placement combines every finish into one number, making it easy to see whether you generally finish higher.
The four-player baseline is 2.50
Why is the four-player baseline 2.50?
If each place from first to fourth occurs 25% of the time, the average is (1 + 2 + 3 + 4) ÷ 4 = 2.50. Assuming all players have exactly equal skill and play enough games, their averages theoretically approach 2.50. Thus, under the same conditions, an average below 2.50 indicates better-than-average results, while an average above 2.50 indicates more difficulty.
The sanma baseline is 2.00
Why is the sanma baseline 2.00?
Sanma has only first, second, and third place, so an equal distribution gives (1 + 2 + 3) ÷ 3 = 2.00. 2.00 is an average result in sanma, but an excellent result in four-player mahjong. The same number has a very different meaning.
Try it in MemoJong: Calculate your average placement automatically →
3. How to Interpret the Numbers
Two averages of 2.40 can tell very different stories
Compare a first-place-focused player with a last-place-avoidance player

| Type | 1st-place rate | 2nd-place rate | 3rd-place rate | 4th-place rate | Average placement |
|---|---|---|---|---|---|
| A: First-place focused | 30% | 25% | 20% | 25% | 2.40 |
| B: Consistent | 15% | 35% | 45% | 5% | 2.40 |
Average placement summarizes the entire placement distribution
A finishes both first and last frequently, while B has fewer firsts but very few lasts. Yet multiplying each placement rate by its place and adding the results gives an average placement of 2.40 for both players.
A may have an advantage under rules that heavily reward first place, while B's consistency may be more valuable under rules that heavily penalize last place. Even with the same average placement, the preferred distribution depends on the rules and your goals.
Review first- and last-place rates together
When your average improves from 2.50 to 2.40, check whether you gained more firsts or reduced your lasts. The former may indicate better ability to secure first place; the latter may indicate more consistent defense and placement management.
Does a 0.05 difference matter?
Is the difference between 2.50 and 2.45 only 0.05?
The 0.05 gap between 2.50 and 2.45 may look small. But multiplying the average-placement difference by the number of games shows the total change in finishing places over that period.
Across 100 games, a 0.05 difference means a difference of 5 in the sum of placements; across 1,000 games, it means 50. Changing a fourth-place finish to third improves that sum by 1, so over 1,000 games the difference is equivalent to 50 such improvements on balance.
What about 100, 500, or 1,000 games?

| Number of games | 0.01 difference in average placement | 0.05 difference | 0.10 difference |
|---|---|---|---|
| 100 games | 1 | 5 | 10 |
| 500 games | 5 | 25 | 50 |
| 1,000 games | 10 | 50 | 100 |
Decimal places matter in average placement
Small decimal differences in average placement become more meaningful over time. Check whether your opponents or rules changed during the period, or whether one short winning streak had an outsized effect.
Do not overvalue small changes in short comparisons such as month to month. For lifetime results, track changes of 0.01 or 0.05 carefully. Keeping these two perspectives separate helps you avoid overreacting to the numbers.
How many games make average placement reliable?
Mahjong results fluctuate greatly in the short term. Treat 10–20 games as a rough reference; even 50 games can change substantially. Trends begin to emerge around 100 games, and 300–500 games become more useful for assessing longer-term results. With 1,000 games or more, you can better understand long-term performance trends.
| Number of games | Assessment |
|---|---|
| Up to 20 games | Rough reference only |
| 50 games | Still highly variable |
| 100 games | Trends start to emerge |
| 300–500 games | Useful reference |
| 1,000+ games | Strong long-term reference |
| Several thousand games | Easier to assess underlying performance trends |
Along with the number of games, check whether the results came from the same rules and table level.
Metrics to review alongside average placement
| Metric | What it tells you |
|---|---|
| Average placement | Overall placement performance |
| First-place rate | Ability to finish first |
| Top-two rate | Proportion of first- and second-place finishes |
| Last-place rate | Proportion of last-place finishes |
| Last-place avoidance rate | Ability to avoid last place |
| Hand-win rate | How often you win hands |
| Deal-in rate | Defensive tendencies |
| Average hand value | Value of each winning hand |
Average placement + first-place rate
First-place rate shows whether you are improving your average by taking more firsts. A good average with a low first-place rate may indicate a consistent style with many seconds. Under rules that heavily reward first place, it is worth checking whether you could convert more opportunities into wins.
Average placement + last-place rate
Last-place rate reflects your consistency in avoiding the bottom. With the same average placement, a high last-place rate may mean many firsts and lasts, while a low rate may mean mostly seconds and thirds. It is particularly important under rules with heavy last-place penalties.
Average placement + game count
Always show the number of games alongside average placement. A figure of 2.20 alone cannot tell you whether it represents a hot streak over 10 games or results over 1,000 games. Game count is essential for distinguishing short-term good fortune from a long-term trend.
Average placement + opponent strength
Knowing the strength of your opponents helps you assess what an average placement means. Record your rank and room in ranked play, the group of participants in private games, or your competitive league. This makes comparisons more meaningful when your playing environment changes.
M.League individual scores include both placement bonuses and base scores derived from final table points. In addition to first-place, top-two, and last-place-avoidance rates, useful metrics include average hand value, hand-win rate, deal-in rate, call rate, and riichi rate.
Check table strength and rule differences
In online mahjong, the value of an average placement depends on the room you play in. Maintaining 2.35 in a room filled with high-ranked players is generally harder than maintaining 2.35 in a beginner-heavy room. Read average placement together with rank and room level.
Your average placement may worsen immediately after you move to a higher room. This does not necessarily mean your skill has declined; your opponents may simply be stronger. Keep results from different rooms separate, and compare results before and after promotion to see how well you are adapting.
Keep four-player mahjong and sanma separate, and separate East-only games from hanchan where possible. Services such as Mahjong Soul and Tenhou differ in matchmaking, rank systems, and rules. Do not treat an average of 2.35 as identical across services; first compare it with your own past results on the same service.
M.League results example
M.League is a four-player mahjong league featuring leading professionals. In the official 2025–26 regular-season results, leading players recorded average placements in the 2.1–2.2 range.
| Player | Average placement | Games played |
|---|---|---|
| Geki Shimoishi | 2.07 | 38 |
| Takanori Nagai | 2.11 | 34 |
| Ken Sonoda | 2.19 | 36 |
| Kotaro Uchikawa | 2.25 | 36 |
| Futoshi Watanabe | 2.27 | 33 |
| Kana Nakada | 2.29 | 27 |
| Aki Nikaido | 2.30 | 26 |
| Sho Shiratori | 2.31 | 35 |
| Kazunori Takizawa | 2.33 | 33 |
| Genta Takeuchi | 2.33 | 33 |
4. Practical Ways to Improve Average Placement
What to focus on to improve your average placement
Reduce last-place finishes
In four-player mahjong, fourth-place finishes significantly worsen your average. When far behind, check realistic conditions for reaching third rather than aiming only for a comeback to first. Changing five fourth-place finishes to thirds over 100 games improves your average placement by 0.05.
This does not mean playing passively from the start with only last-place avoidance in mind. Aim to gain points while gaps are small early on, then assess the value of each possible finish as the final standings become clearer.
Reduce unnecessary pushing
When an opponent declares riichi, check your shanten count, your potential hand value, and your available safe tiles. Pushing several dangerous tiles with a cheap hand far from tenpai can expose you to a deal-in loss much larger than the possible reward.
A push-or-fold decision cannot be judged solely by whether you dealt in. Review the turn, wait, hand value, and standings at the time of the decision in the replay, and develop criteria you can apply again in similar situations.
Commit to first place when the situation calls for it
Avoiding last is important, but excessive defense may increase your second-place finishes while reducing firsts, leaving your average short of your goal. With an early good wait or a valuable hand, there are situations where pushing is the right way to secure first place.
Under rules with a large first-place bonus, taking some risk to overtake the leader can be worth more than safely settling for a close second. Include your rules' placement bonuses in that decision.
Check placement requirements in the final hand
At the start of the final hand, work out how many points you need to move up one place. The required value may differ between ron and tsumo, or your placement may depend on which opponent you win from.
Include riichi deposits, honba, and dealer status in your calculation. This helps avoid cheap wins that do not improve your placement or discards that dismantle the hand you need. Recalculating complex scenarios after games is a useful way to practice.
Adjust push-or-fold decisions to the standings
Even with the same hand, the value of pushing a dangerous tile differs when you are first or last. A leader benefits from progressing the game while avoiding a large deal-in. A player in last may need to take some risk because safely folding will not improve their placement.
Look beyond the points won or lost in the current hand and consider how the result affects your final placement.
Prioritize final placement, not just the next hand win
Winning whenever you can is not always the best choice in mahjong. A cheap win that ends your dealer turn may be disadvantageous, while simply advancing the game can be very valuable when you are leading.
Get into the habit of asking not just how many points a win earns, but what place you will be in afterward and where you will stand at the start of the next hand. This makes it easier to choose with final placement in mind.
Do not focus on average placement alone
Changing your style after every short-term fluctuation can be counterproductive. Correct decisions can still lead to last place, and reckless pushes can occasionally succeed and produce a first-place finish.
Use average placement to understand your results. To improve them, also review first-place rate, last-place rate, deal-in rate, and the decisions in your replays.
Useful hands to review include those where you faced an opponent's early riichi, were third or lower in the South round, or failed to improve your placement in the final hand. Follow your hand from the starting tiles and examine your wait, hand value, and point gaps when you pushed.
Related guides
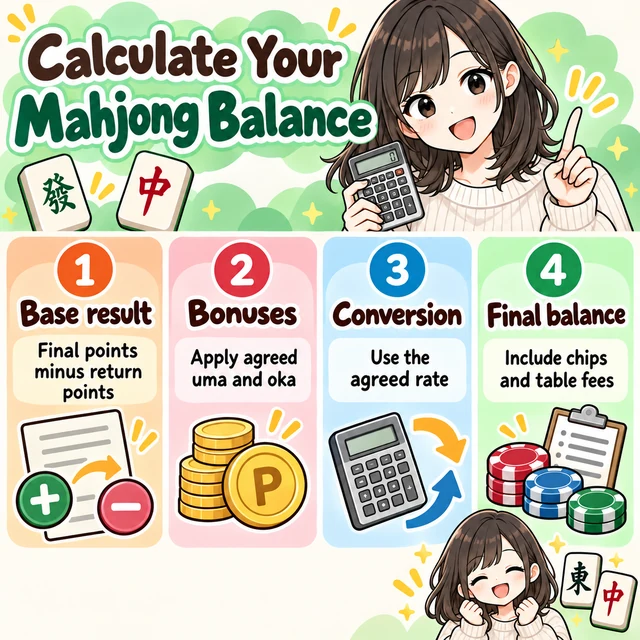 How to Calculate Mahjong Net ResultsCalculate game scores and actual balance separately
 Choosing a Mahjong Results TrackerCompare paper, spreadsheets, and apps
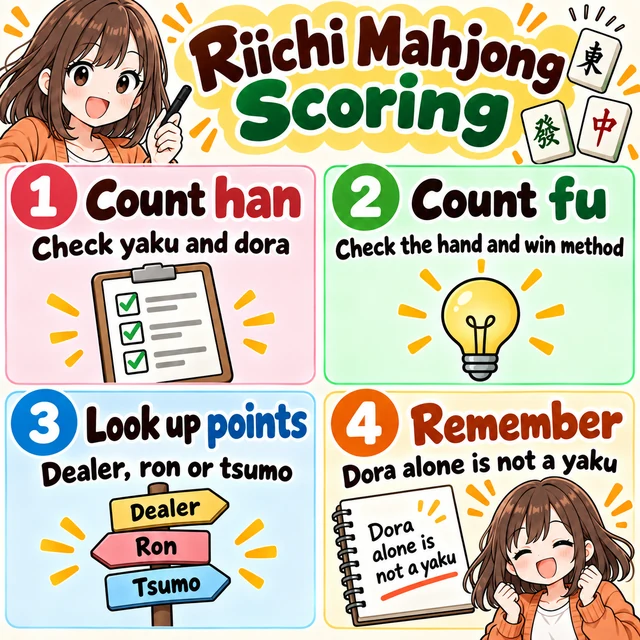 A straightforward guide to mahjong scoringWork through fu and han in order
 Tracking Three-Player Mahjong ResultsTrack three-player placements and settlements separately
 Mahjong defense guideReview genbutsu, suji, kabe, and game results